We recently analyzed 1 million business Google reviews to answer the question:
What matters most to customers?
Specifically, we analyzed 1,048,576 Google reviews from 6,183 small businesses across various industries to determine what attributes of these businesses are mentioned the most in reviews, what drives customers to leave 5-star reviews vs. 1-star reviews, and what’s most important to the customers of specific business types, such as restaurants.
We identified the most frequently mentioned business attributes in this report.
Let’s start by looking at a summary of our key findings.
Summary of our key findings
- Staff friendliness is the most frequently mentioned attribute in online reviews across all industries, appearing in 13.1% of all small business reviews.
- The strongest drivers of 5-star reviews are staff professionalism, product/service selection, and fair pricing.
- Low-star reviews frequently stem from problems with the payment process and online information accuracy.
- Customers are increasingly looking for a simple process. Customer reviews highlighting a simple process (e.g., easy in-and-out, clear next steps) increased by 162.4% over the last two years compared to the prior two years.
Industry-specific key findings:
- Taste and food quality comes up in 18.9% of all restaurant reviews.
- In retail store reviews, 21.8% mention how helpful (or unhelpful) store employees were during their visit.
- Cleanliness of the room is cited in 41.0% of hotel reviews, while 38.1% specifically reference housekeeping service.
- 23.7% of salon reviews highlighted the quality of work — whether for nails, hair, or other services.
- Salesperson helpfulness is a focus in 32.7% of all car dealer reviews.
- Food or drink quality is mentioned in 29.1% of coffee shop reviews.
- Nearly half (49.6%) of dentist reviews mention staff friendliness.
- Professionalism of technicians show up in 36.6% of HVAC customer reviews.
- 26.2% of grocery store reviews reference the service quality at the store’s deli.
- Cost is mentioned in 27.8% of barber reviews.
Staff friendliness is the most frequently mentioned attribute in online reviews across all industries
13.1% of all small business reviews mention staff friendliness, in either a positive or negative context.
Notably, staff friendliness is mentioned 63.6% more often than the next most mentioned attribute of pricing.
Note: As part of this study, we analyzed 681 different business types and industries. While certain attributes outrank staff friendliness within specific verticals, this section focuses on overall trends across all businesses. Later in the report, we’ll dive into 10 specific business categories and highlight the most frequently mentioned attributes within each.
Here’s a list of the top 25 attributes mentioned across all of the 1 million reviews we analyzed:

Among the top 25 most-mentioned attributes, five directly related to the business’s staff: Friendliness, Professionalism, Helpfulness, Efficiency, and Knowledge.
The adage “people are your greatest asset” as a business rings true with this finding. Small businesses who invest in their team are directly impacting what customers care about most.
Definitions of each attribute in these findings:
Staff Friendliness (13.1%): The politeness and welcoming demeanor of staff during interactions with customers.
Pricing (8.0%): The general perceived cost of products or services offered by the small business.
Cleanliness (6.7%): The overall state of hygiene and tidiness of a business’s premises.
Kid/Family Friendliness (6.4%): How welcoming and accommodating a business is to children and families.
Ease Of Purchasing (5.6%): The overall simplicity and convenience of buying products or services from the business.
Staff Professionalism (5.5%): The courteous and ethical conduct of staff.
Speed Of Service (5.2%): How quickly customers receive service.
Staff Helpfulness (5.0%): The willingness and ability of staff to assist customers effectively.
Parking (4.8%): The availability, convenience, and ease of access to parking for a business.
Hours Of Operation (4.4%): The convenience and flexibility of a business’s operating hours for customers.
Staff Efficiency (3.7%): The effectiveness and promptness of staff.
Staff Knowledge (2.9%): The expertise of staff regarding products, services, or policies.
Product Selection (2.8%): The range and choice of products available for customers to choose from.
Atmosphere (2.8%): The overall feeling, mood, or character of a business’s physical space.
Phone Etiquette (2.8%): The politeness and professionalism of staff when interacting with customers over the phone.
Odors & Smell (2.7%): The perceived pleasantness or unpleasantness of a business’s ambient smells.
Fair Pricing (2.7%): The perceived reasonableness of a business’s pricing structure.
Location (2.6%): The convenience, accessibility, and desirability of a business’s physical address.
Business Website/App Experience (2.5%): The overall usability, navigation, and functionality of a business’s website or mobile app.
Deals/Discounts (2.2%): The perceived value and attractiveness of special offers, promotions, or sales.
Community Involvement (2.1%): A business’s participation in or support for local events, causes, or initiatives.
Local Sourcing (1.9%): A business’s practice of obtaining products or ingredients from local suppliers.
Unique Offerings (1.9%): Distinctive products, services, or experiences that set a business apart from competitors.
Neighborhood Feel (1.8%): The integration of a business into its local community.
Price Transparency (1.6%): How clear and upfront a business is about all its pricing and fees, with no hidden costs.
These findings represent what attributes were mentioned across all reviews, good or bad.
Next, we’ll specifically focus on findings from our analysis of 5-star reviews.
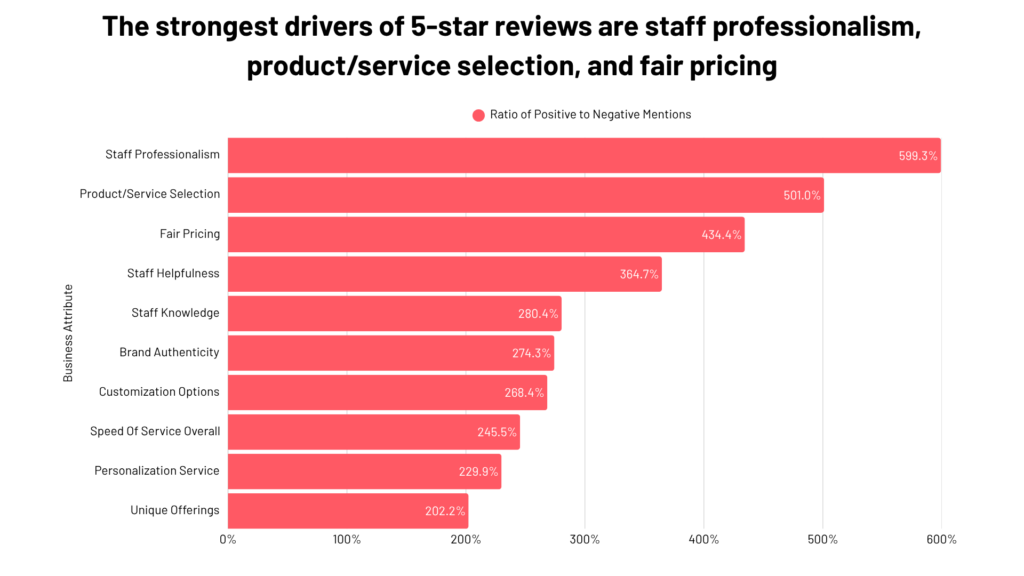
The strongest drivers of 5-star reviews are staff professionalism, product/service selection, and fair pricing
Most small businesses aim to give their customers a great experience, but what does that mean tactically?
In our analysis, we identified which attributes appeared disproportionately more often in 5-star reviews than in 1-star reviews. In other words, these attributes are strong indicators of customer satisfaction and likely play a key role in driving positive experiences that lead to 5-star ratings.
The top three reasons customers leave 5-star reviews are staff professionalism, product selection or variety, and fair pricing. Together, these attributes appear in 8.6% of all 5-star reviews, with staff professionalism alone mentioned in 5.1% of reviews.
In addition, several attributes driving 5-star reviews reflect the unique appeal of small businesses (the focus of this analysis), including brand authenticity, unique offerings, and personalized service.
Below are the top 10 attributes most mentioned in 5-star reviews, ranked by how much more frequently they appear in 5-star reviews compared to 1-star reviews. For example, a “599.3%” ratio means that the professionalism (or lack thereof) is mentioned nearly six times more often in a 5-star review than in a 1-star review.
Definitions of each attribute in these findings:
Staff Professionalism (599.3%): The courteous and ethical conduct of staff.
Product/Service Selection (501.0%): The range and choice of products or services available for customers.
Fair Pricing (434.4%): The perceived justice and reasonableness of a business’s pricing structure.
Staff Helpfulness (364.7%): The willingness and ability of staff to assist customers effectively.
Staff Knowledge (280.4%): The expertise and informedness of staff regarding products, services, or policies.
Brand Authenticity (274.3%): The perceived genuineness, unique identity, and consistent adherence to stated values of the business.
Customization Options (268.4%): The ability to tailor products or services to individual customer preferences.
Speed Of Service Overall (245.5%): The general quickness and efficiency of the entire service process.
Personalization Service (229.9%): The degree to which a service is tailored to individual customer needs or preferences.
Unique Offerings (202.1%): Distinctive products, services, or experiences that set a business apart from competitors.
Next, we’ll take a look at the inverse: which attributes show up more frequently in 1-star reviews?
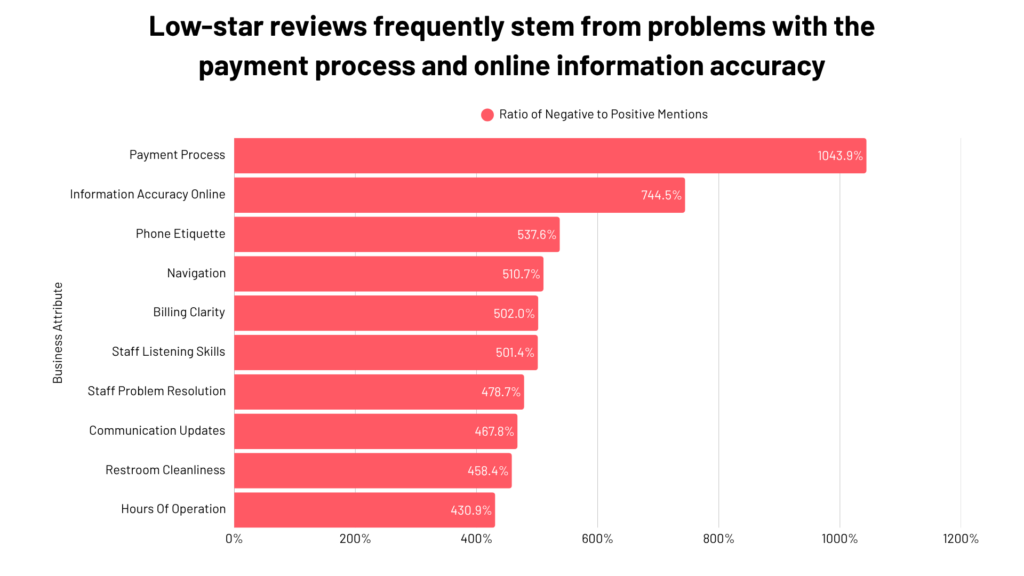
Low-star reviews frequently stem from problems with the payment process and online information accuracy
According to a study published in the Journal of Marketing Research, just one bad review can reduce purchasing intent by 42%.
Most small businesses receive some low-star reviews, but we set out to identify the common themes that appear more frequently in negative reviews than in positive ones. In other words, we aimed to uncover the key pain points that disproportionately contribute to customer dissatisfaction.
In our analysis of over 1 million customer reviews, we identified nearly 100 recurring themes in negative reviews. However, two stood out as outliers: issues with the payment process and inaccurate information online.
Below are the top 10 attributes most mentioned in 1-star reviews, ranked by how much more frequently they appear in 1-star reviews compared to 5-star reviews. For example, a “1043.9%” ratio means payment process is mentioned about 10x more often in a 1-star review than in a 5-star review.
Definitions of each attribute in these findings:
Payment Process (1043.9%): The overall experience of completing a transaction, from queueing to final payment.
Information Accuracy Online (744.5%): The accuracy of information provided on a business’s online platforms.
Phone Etiquette (537.6%): The politeness and professionalism of staff when interacting over the phone.
Navigation (510.7%): The ease with which customers can find their way around a business’s physical or digital space.
Billing Clarity (502.0%): How transparent and easy-to-understand a customer’s bill, invoice, or statement is.
Staff Listening Skills (501.4%): The ability of staff to actively hear and understand customer needs.
Staff Problem Resolution (478.7%): The effectiveness and skill of staff in resolving customer issues or complaints.
Communication Updates (467.8%): How well a business keeps customers informed about order status, service progress, or changes.
Restroom Cleanliness (458.4%): The hygiene standards and upkeep of a business’s restrooms.
Hours Of Operation (430.9%): The convenience and flexibility of a business’s operating hours for customers.
Before we move on from negative reviews, it’s noteworthy to call out one customer behavior heavily impacting these findings:
Customers tend to leave negative reviews only when their expectations are not met
In our study, certain topics appear frequently in 1- and 2-star reviews when a business fell short, but are rarely mentioned in 5-star reviews, even when the business excelled in those same areas.
This suggests that some attributes are taken for granted when they meet expectations, but become noticeable (and worth mentioning) when they’re lacking.
Bathroom cleanliness is a great example of this. Out of the 1 million reviews we analyzed, 8,273 reviews mentioned how clean or unclean the business’s bathroom was. Only 184 of those reviews were positive reviews.

Our study reveals that customers care about certain attributes but some attributes are considered table stakes and not worth mentioning when they are adequate.
Next, we’ll take a look at recent trends we found in our study.
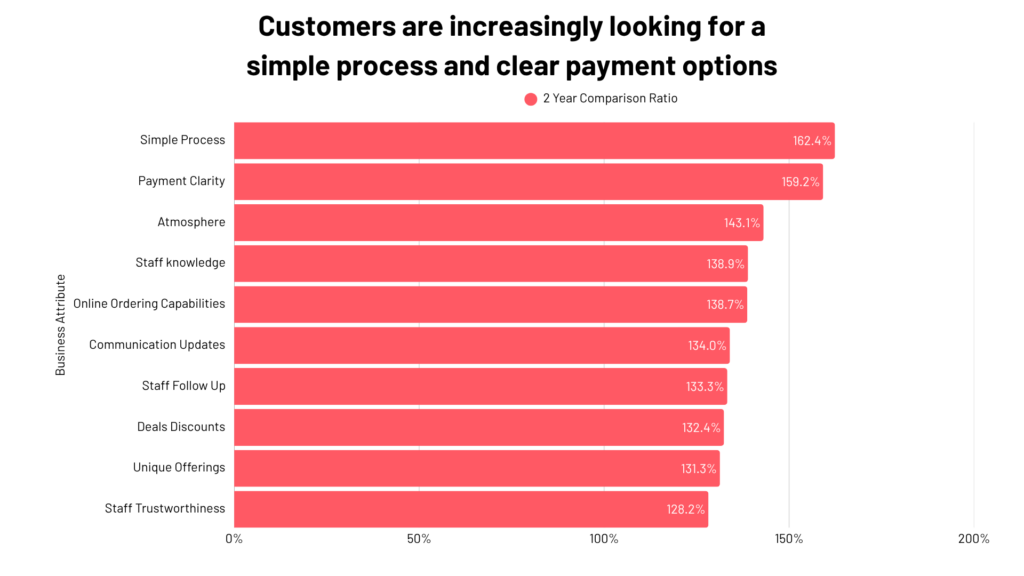
Customers are increasingly looking for a simple process and clear payment options
Customer preferences are always changing, so we dug into some trend data to determine if there were attributes more frequently mentioned in the last 2 years (July 2023 – June 2025) compared to the prior two years (July 2021 – June 2023).
Reviews highlighting a simple process (e.g., easy in-and-out, clear next steps) increased by 162.4% over the last two years compared to the prior two years.
Payment clarity is another growing trend, with mentions increasing by 159.2% in the last two years compared to the previous two. As more and more small businesses offer digital payment options beyond cash, customers are increasingly calling out businesses where the payment methods are not clear (e.g., credit card fees, no digital payments), making it a frequent topic in reviews.
Here’s a look at the top 10 attributes showing an upward trend:
Definitions of each attribute in these findings:
Simple Process (162.4%): The straightforwardness and ease of understanding for various customer-facing processes.
Payment Clarity (159.2%): The transparency and straightforwardness of the payment process, including upfront cost understanding.
Atmosphere (143.1%): The overall feeling, mood, or character of a business’s physical space.
Staff knowledge (138.9%): The expertise and informedness of staff regarding products, services, or policies.
Online Ordering Capabilities (138.7%): The availability and functionality of online systems for placing product orders.
Communication Updates (134.0%): How well a business keeps customers informed about order status, service progress, or changes.
Staff Follow Up (133.3%): Whether staff contact customers after a service or purchase to ensure satisfaction.
Deals Discounts (132.4%): The perceived value and attractiveness of special offers, promotions, or sales.
Unique Offerings (131.3%): Distinctive products, services, or experiences that set a business apart from competitors.
Staff Trustworthiness (128.2%): The perceived honesty and reliability of staff.
Next, we’ll break down what customers of some popular small business types care about.
Small business insights by industry
We analyzed 10 specific business types to identify attributes relevant to each industry.
We’ll start by looking at the restaurant industry.
Restaurants
18.9% of all restaurant reviews mention the taste and quality of the food.
While factors like staff, pricing, and speed also influence customer opinions, the primary focus remains on the food itself.
Note: For a deeper dive into the foodservice sector, we recommend checking out RightResponse AI’s analysis of over 100,000 restaurant reviews to uncover what diners value most, including some interesting findings on review sentiment. See RightResponse AI’s full report for more information.

Definitions of each attribute in these findings:
Food Quality & Taste (18.9%): The flavor, freshness, and overall quality of food and dishes.
Staff Friendliness (12.8%): The politeness and welcoming demeanor of staff.
Price (8.1%): The general perceived cost of products or services offered by the business.
Speed Of Service (7.9%): The quickness with which a service is performed or delivered.
Drink Selection (7.7%): The variety and quality of beverages offered.
Ease Of Ordering (7.4%): The overall simplicity and convenience of placing an order or making a booking.
Wait Time (7.2%): The overall time customers spend waiting for service, a table, or any stage in the process.
Menu Variety (7.2%): The range and selection of food and beverage items available.
Freshness of Ingredients (6.6%): The quality and freshness of raw components used in food or products.
Portion Size (6.0%): The quantity or serving size of food items.
Retail stores
21.8% of all retail store reviews mentioned how helpful (or unhelpful) store employees were in their visit.
Even above product availability and the prices, staff helpfulness is the most mentioned attribute in reviews.

Definitions of each attribute in these findings:
Staff Helpfulness (21.8%): The willingness and ability of staff to assist customers effectively.
Product Cost (20.9%): The perceived cost of specific products offered by the business.
Product Availability (14.8%): The presence of specific products or stock, ensuring items are in stock and can be found.
Deals/Discounts (13.0%): The perceived value and attractiveness of special offers, promotions, or sales.
Staff Friendliness (12.7%): The politeness and welcoming demeanor of staff.
Unique Offerings (12.5%): Distinctive products, services, or experiences that set a business apart from competitors.
Product Variety (12.2%): The range and choice of products available for customers to choose from.
Sales Approach (11.2%): The demeanor and tactics used by sales staff (e.g., whether they are pushy or helpful).
Ease of Store Navigation (10.4%): How easily customers can find their way around a store and locate items.
Merchandise Quality (10.1%): The overall standard and durability of products sold in a retail store.
Hotels
41.0% of all hotel reviews mentioned the cleanliness (or lack thereof) of the room. Similarly, 38.1% referenced the housekeeping service.
Beyond cleanliness, guests also place importance on amenities: the bathrooms, gym, pool or spa, and the breakfast provided.

These attributes carried the most weight per industries across all the small business industries we analyzed. The fact that some of the hotel attributes in these findings were mentioned in over a third of all reviews is a strong indicator of what guests genuinely value.
Definitions of each attribute in these findings:
Room Cleanliness (41.0%): The hygiene and tidiness of a hotel room.
Housekeeping Service (38.1%): The quality and consistency of room cleaning services in a hotel.
Bathroom Quality (36.0%): The overall standard and cleanliness of a hotel room’s bathroom, including features and water pressure.
Pool/Spa/Gym (35.8%): The quality, cleanliness, and functionality of a hotel’s recreational facilities like pools, spas, or fitness centers.
Breakfast (32.6%): The quality, variety, and service of the breakfast or dining options offered by a hotel.
Cleanliness of Common Areas (31.3%): The cleanliness of shared spaces within a business, such as lobbies, hallways, or waiting areas.
Staff Friendliness (31.0%): The politeness and welcoming demeanor of staff.
Room Size (23.8%): The perceived spaciousness or compactness of a hotel room.
Pet Friendliness (17.1%): How welcoming and accommodating a business is to customers with pets.
Bed Comfort (16.8%): The quality and comfort level of a hotel room’s bed and pillows.
Salons
23.7% of all salon reviews mentioned the quality of the work, whether for nails, hair, or other services.
Beyond the results themselves, customers also care about cost, staff friendliness (a recurring theme), and staff expertise.

Definitions of each attribute in these findings:
Quality of Work (23.7%): The overall standard, skill, and effectiveness of the service provided to the customer.
Service Cost (20.8%): The perceived cost of specific services offered by the business.
Staff Friendliness (18.8%): The politeness and welcoming demeanor of staff.
Staff Knowledge (17.2%): The expertise and informedness of staff regarding products, services, or policies.
Staff Consultation (14.5%): The thoroughness and effectiveness of discussions between a customer and a service provider (e.g., stylist, technician).
Salon Ambiance (12.5%): The overall feeling and atmosphere of a hair or nail salon.
Staff Skill (12.4%): The technical competence and expertise of staff in performing their specific tasks.
Wait Times (12.4%): The overall time customers spend waiting for service or any stage in the process.
Cleanliness (11.1%): The overall state of hygiene and tidiness of a business’s premises.
Ease Of Booking an Appointment (10.1%): How simple and convenient it is to book or schedule appointments.
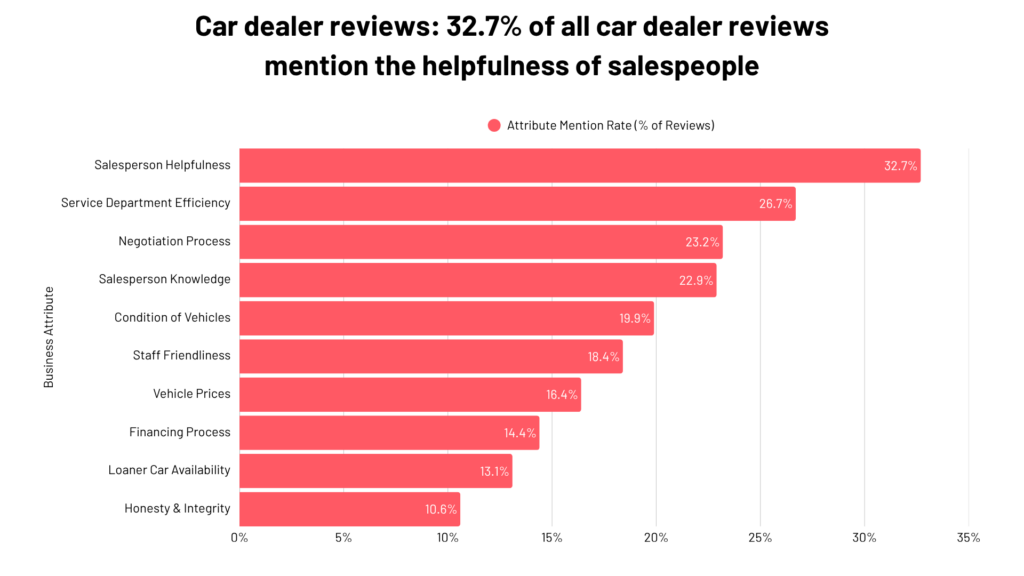
Car Dealers
32.7% of all car dealer reviews mentioned how helpful (or unhelpful) salespeople were in their visit.
After-sale servicing also plays a role. 26.7% of all reviews mentioned the efficiency of the dealers’ service department.
The negotiation process ranked high for car dealer reviews, but not for any other small business categories we analyzed. 23.2% of car dealer reviews mentioned it. In many cases, customers weren’t necessarily involved in tough negotiations but expressed relief at how smooth and hassle-free the process was.
Definitions of each attribute in these findings:
Salesperson Helpfulness (32.7%): The assistance and guidance provided by a car salesperson to customers.
Service Department Efficiency (26.7%): The speed and organization of a car dealership’s service department.
Negotiation Process (23.2%): The perceived fairness and ease of negotiating prices or terms at a car dealership.
Salesperson Knowledge (22.9%): The expertise and information a car salesperson possesses about vehicles and features.
Condition of Vehicles (19.8%): The physical state and upkeep of vehicles available at a car dealership.
Staff Friendliness (18.4%): The politeness and welcoming demeanor of staff.
Vehicle Prices (16.4%): The perceived cost of vehicles offered by the dealership.
Financing Process (14.4%): The clarity, ease, and fairness of a car dealership’s financing and loan application process.
Loaner Car Availability (13.1%): The presence and ease of access to loaner or rental cars during vehicle service.
Honesty & Integrity (10.6%): The perceived truthfulness and ethical behavior of a business or its staff.
Coffee Shops
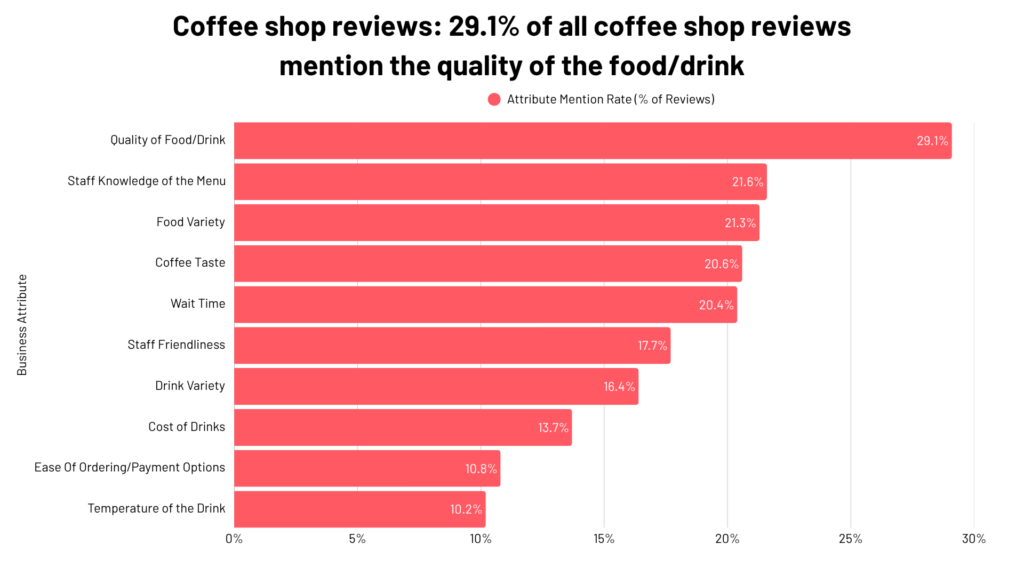
29.1% of all coffee shop reviews mentioned the quality of the food or drinks they purchased.
Beyond that, customers also appreciate staff who are well-versed in the menu. 21.6% of reviews specifically referenced the staff’s menu knowledge.
Definitions of each attribute in these findings:
Quality of Food/Drink (29.1%): The overall quality, freshness, and flavor of food and beverages offered.
Staff Knowledge of the Menu (21.6%): The expertise of staff regarding menu items, allowing them to provide accurate information and recommendations.
Food Variety (21.3%): The range and selection of food items available, especially pastries or light bites in a coffee shop.
Coffee Taste (20.6%): The flavor, preparation, and overall quality of coffee beverages offered by a coffee shop.
Wait Time (20.4%): The overall time customers spend waiting for service, their order, or any stage in the process.
Staff Friendliness (17.7%): The politeness and welcoming demeanor of staff.
Drink Variety (16.4%): The range and selection of beverages offered.
Cost of Drinks (13.7%): The perceived cost of beverages offered by the coffee shop.
Ease Of Ordering/Payment Options (10.8%): The overall simplicity and convenience of placing an order and making a payment.
Temperature of the Drink (10.2%): The exact temperature of beverages served (e.g., hot coffee, cold iced tea).
Dentists
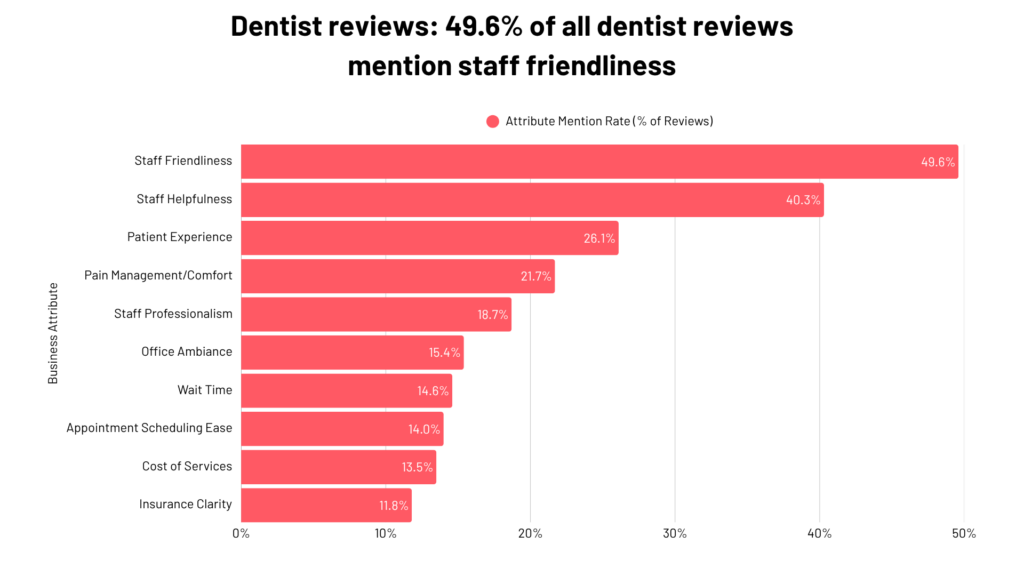
49.6% of all dentist reviews mention staff friendliness. Additionally, 40.2% reference how helpful the staff were.
Definitions of each attribute in these findings:
Staff Friendliness (49.6%): The politeness and welcoming demeanor of staff.
Staff Helpfulness (40.3%): The willingness and ability of staff to assist customers effectively.
Patient Experience (26.1%): The overall quality of care, interaction, and comfort a patient receives during their visit.
Pain Management/Comfort (21.7%): The effectiveness of measures taken to control or alleviate pain and ensure comfort during procedures.
Staff Professionalism (18.7%): The competent, courteous, and ethical conduct of staff.
Office Ambiance (15.4%): The overall feeling and atmosphere of a dental office’s waiting room or treatment areas.
Wait Time (14.6%): The overall time customers spend waiting for service or any stage in the process.
Appointment Scheduling Ease (14.0%): How simple and convenient it is to book or schedule appointments.
Cost of Services (13.5%): The perceived cost of specific services offered by the business.
Insurance Clarity (11.8%): The transparency and ease of understanding regarding dental or medical insurance coverage and billing.
HVAC Contractors
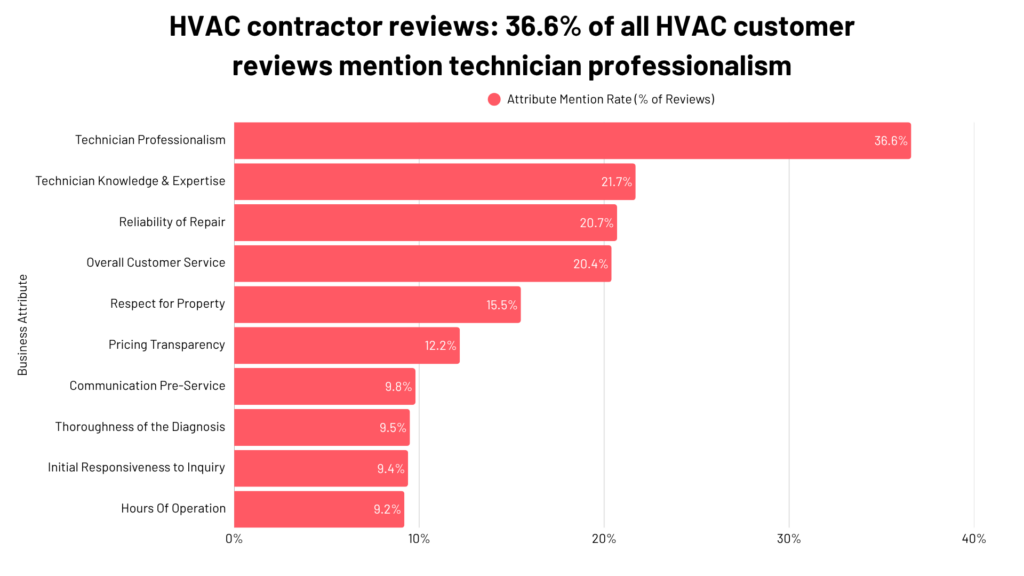
36.6% of all HVAC customer reviews mention how professional their technician was.
About 1 in 5 HVAC customer reviews mention each of the following attributes: technician knowledge and expertise, work reliability, and overall customer service. While some reviews mention more than one of these, these factors consistently stand out to customers.
Definitions of each attribute in these findings:
Technician Professionalism (36.6%): The competent, courteous, and ethical conduct of technicians during service calls.
Technician Knowledge & Expertise (21.7%): The diagnostic skill, understanding, and informedness of technicians regarding systems and problems.
Reliability of Repair (20.7%): How consistently and effectively a repair or service fix holds up over time.
Overall Customer Service (20.4%): The general helpfulness, politeness, and responsiveness of a business’s office or support staff.
Respect for Property (15.5%): The care taken by service professionals to keep a customer’s property tidy and undamaged during work.
Pricing Transparency (12.2%): How clear and upfront a business is about its pricing and fees, with no hidden costs.
Communication Pre-Service (9.8%): How well service professionals communicate with customers before starting work, including arrival times or initial assessments.
Thoroughness of the Diagnosis (9.5%): How completely and accurately a technician identifies a problem’s root cause.
Initial Responsiveness to Inquiry (9.4%): How quickly a business responds to customer calls or initial inquiries.
Hours Of Operation (9.2%): The convenience and flexibility of a business’s operating hours for customers.
Grocery Stores
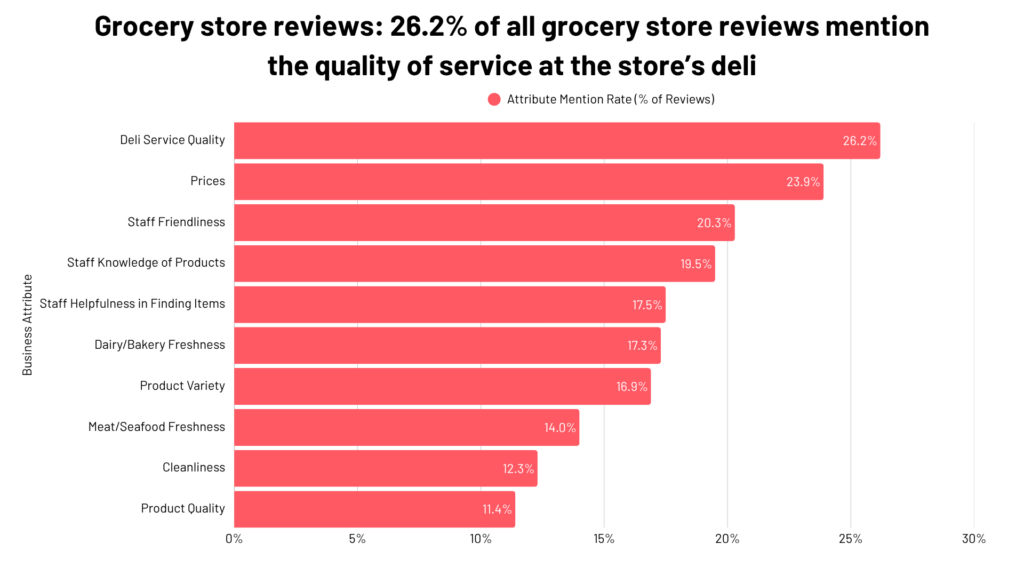
26.2% of all grocery store reviews mention the quality of service at the store’s deli.
In addition, grocery store pricing, staff friendliness, and product knowledge are among the top factors important to customers.
Definitions of each attribute in these findings:
Deli Service Quality (26.2%): The quality of service, product freshness, and efficiency at a grocery store’s deli counter.
Prices (23.9%): The general perceived cost of products offered by the business.
Staff Friendliness (20.3%): The politeness and welcoming demeanor of staff.
Staff Knowledge of Products (19.5%): Staff expertise regarding specific retail or grocery store products.
Staff Helpfulness in Finding Items (17.5%): Staff assistance in locating specific products in a store.
Dairy/Bakery Freshness (17.3%): The freshness and quality of dairy products and baked goods.
Product Variety (16.9%): The range and selection of products offered.
Meat/Seafood Freshness (14.0%): The freshness and quality of meat and seafood products.
Cleanliness (12.3%): The overall state of hygiene and tidiness of a business’s premises.
Product Quality (11.4%): The overall standard and craftsmanship of products offered.
Barber Shops
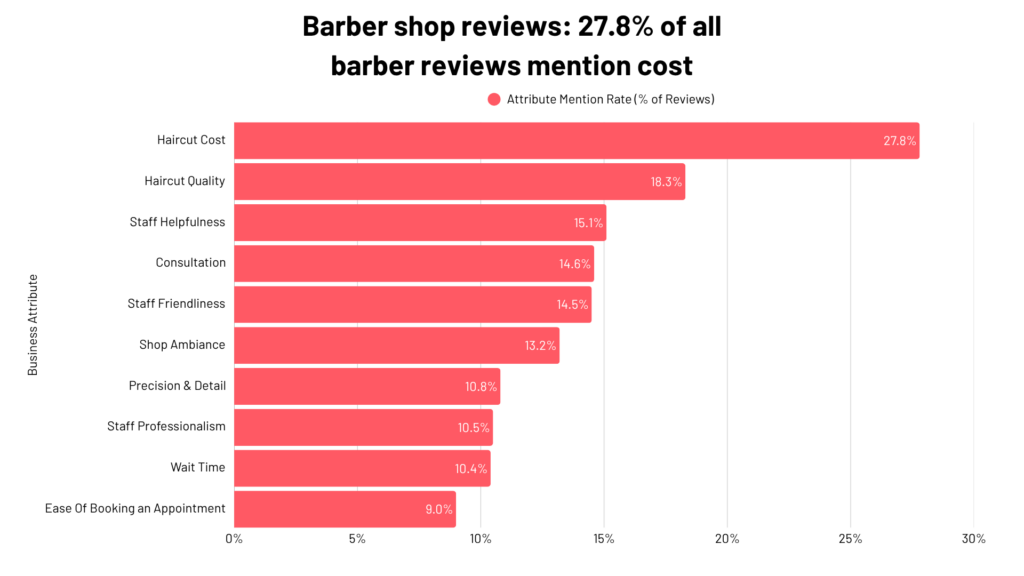
27.8% of all barber reviews mention cost.
Among the small business industries we analyzed, barber shops are the only ones where the most frequently mentioned attribute is the cost of the service or product.
Definitions of each attribute in these findings:
Haircut Cost (27.8%): The perceived cost of haircut services offered by the business.
Haircut Quality (18.3%): The skill and outcome of a haircut provided to the customer.
Staff Helpfulness (15.1%): The willingness and ability of staff to assist customers effectively.
Consultation (14.6%): The thoroughness and effectiveness of discussions between a customer and a service provider (e.g., barber, stylist).
Staff Friendliness (14.5%): The politeness and welcoming demeanor of staff.
Shop Ambiance (13.2%): The overall feeling and atmosphere of a barber shop.
Precision & Detail (10.8%): The meticulousness and exactness of a haircut or styling service.
Staff Professionalism (10.5%): The competent, courteous, and ethical conduct of staff.
Wait Time (10.4%): The overall time customers spend waiting for service or any stage in the process.
Ease Of Booking an Appointment (9.0%): How simple and convenient it is to book or schedule appointments.
Bonus: 71.5% of all small business reviews are 5-star reviews
More than 1 in 7 small business reviews are 5-star.
The second most common rating is 4-star, accounting for 14.1% of all reviews.
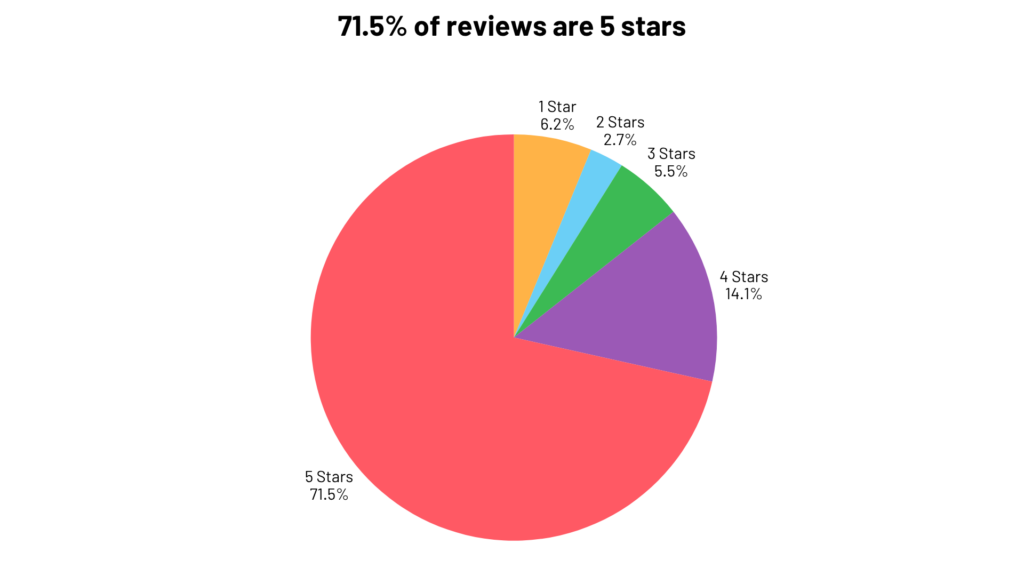
Although this doesn’t reveal much about what matters most to small business customers, it does provide an interesting insight: most customers are having positive experiences.
Conclusion
Small businesses drive America’s economy. We hope this report serves as a useful resource for understanding what matters most to their customers.
If you’d like to learn more about how we collected and analyzed our data, here is a link to our methodology for this study.
The team behind this study
Lanc Local is a regional small business publication, primarily for Lancaster County, PA, providing in-depth small business analysis and local guide write-ups as a resource for small business owners and their customers.